June 29, 2021

Every four years, Washington D.C. and Wall Street converge as Americans elect a president and Wall Street tries to figure out what the outcome means for the stock and bond markets. And since so many hypotheses on this topic abound, it’s hard to keep track of them all.
For example, there are those who believe stocks have better results when:
- A president is re-elected to a second term;
- A new president from a different party is elected; or
- There is a Republican/Democrat president.
But what if we ranked the presidents simply by the results of the main stock market indexes, the Dow Jones Industrial Average (DOW) and the S&P 500? Surely that would settle the debate as to which president was best for investors, right? Before we begin, there are a few big caveats to consider.
The Four Big Caveats
Caveat #1: Since the Office of the President was established in 1789, America has had 45 different presidents. And just three years later, Wall Street was officially founded on May 17, 1792 with the signing of the Buttonwood Agreement. But for the most part, there really was no stock market until the late 1800s, meaning it doesn’t make sense to include the first 22 presidents. This analysis starts with the election of 1888.
Caveat #2. The Dow Jones Industrial Average was first published on May 26, 1896 and it followed the 12 largest companies in each sector. Today, it tracks 30 companies. The other very commonly-used index – the S&P 500 – although introduced in 1957 it does track data back to the late 1920s. Our series uses the S&P 500 from President Hoover to the present, and the DOW for earlier.
Caveat #3. Results do not include dividends. Over the last few decades, dividends have become a smaller component of total returns, so not including dividends will tend to favor more recent presidents.
Caveat #4. Data is not adjusted for inflation.
This will tend to help presidents of inflationary times (Carter and Ford) and
hurt presidents of deflationary times (Hoover and Bush).
Parts I – V: #1 – #19
Parts I – IV brought us this list:
#1: President Herbert Hoover (-30.8% per year)
#2: President George W. Bush (-5.6% per year)
#3: President Grover Cleveland (-4.9% per year)
#4: President Richard Nixon (-3.9% per year)
#5: President Benjamin Harrison (-1.4% per year)
#6: President William Howard Taft (-0.1% per year)
#7: President Theodore Roosevelt (2.2% per year)
#8: President Woodrow Wilson (3.1% per year)
#9: President Franklin Roosevelt (6.2% per year)
#10: President John Kennedy (6.5% per year)
#11: President Jimmy Carter (6.9% per year)
#12: President Warren Harding (6.9% per year)
#13: President: Lyndon Johnson (7.7% per year)
#14: President Harry Truman (8.1% per year)
#15: President Ronald Reagan (10.2% per year)
#16: President Gerald Ford (10.8% per year)
#17: President Dwight Eisenhower (10.9% per year)
#18: President George H.W. Bush (11.0% per year)
#19: President William McKinley (11.3% per year)
Ranking from Worst to Best (#20 – #23)
#20 of 23

- Market Results: 13.7% per year
- Term: January 20, 2017- January 20, 2021
- Election Year: 2016
President Donald Trump is one of only five Presidents ever elected to never been elected to public office before. During his campaign, he vowed to Make America Great Again by putting America first and bolstering the economy.
He installed three Supreme Court justices, established the sixth branch of the US Armed Forces-Space Force, successfully passed tax reform and presided over strong economic growth.
His biggest opponent was likely the COVID-19 pandemic in which he himself tested positive for while in office. He is also the first President to ever be impeached twice. With President Trump being the latest to leave office, his legacy is still evolving.
#21 of 23

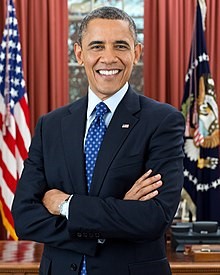
President Barak Obama, Democrat
- Market Results: 13.8% per year
- Term: January 20, 2009 – January 20, 2017
- Election Year: 2008 and 2012
President Barack Obama took office during the Great Recession, which lasted officially from December 2007 until June 2009. While the Great Recession was fueled by a number of causes, the housing bubble in 2006 and 2007, followed by the subprime mortgage crisis in 2007 and 2008, hurt American households and the financial sector especially hard. And one of President Obama’s first acts was signing the American Recovery and Reinvestment Act of 2009 that aimed to help the country out of its deepening recession.
Critics will suggest that President Obama benefited from timing, as he took office just as the Great Recession was nearing its end so there was nowhere for the market to go but up. But with positive returns for the S&P 500 during every year of his presidency, including 6 of the 8 years in double-digits, it’s easy to see why he ranks so high.
#22 of 23

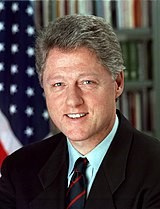
President Bill Clinton, Democrat
- Market Results: 15.2% per year
- Term: January 20, 1993 – January 20, 2001
- Election Year: 1992 and 1996
President Bill Clinton presided over one of the most exciting and longest bull markets in history. And while it was not as long as the most recent 11-year bull market, the gains were bigger. Consider the bull market run that saw the S&P 500 move from a low of 295.46 on October 11, 1990 and rise to 1,527.46 on March 24, 2000 – an increase of 546% on a total return basis.
Fueled by the dot-com boom of the 90s, investors saw the emergence of the internet and new technology companies that fundamentally reshaped the U.S. and world economies.
With gains in 7 of the 8 years during the Clinton presidency (2000 saw the S&P 500 lose 9.1%), there was a five-year run from 1995 to 1999 that saw annual returns of 37.2%; 22.7%; 33.0%; 28.6%; and 21.0%.
#23 of 23

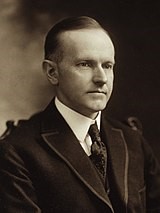
President Calvin Coolidge, Republican
- Market Results: 26.1% per year
- Term: August 2, 1923 – March 4, 1929
- Election Year: 1924
The very best President – as measured by annual stock market performance – was so far out in front it will make one look again. President Calvin Coolidge saw average annual returns of 26.1% in his 5 ½ years in office, coming close to the returns of President Obama AND President Clinton’s years combined.
President Coolidge presided over the boom years called the Roaring Twenties – and he left office just as the party was ending – about six months before the Great Crash of 1929 ushered in the Great Depression.
Whether it was luck or not, the fact is that the Dow Jones Industrial Average soared an astonishing 266% during his presidency.
Important Disclosures
All information is believed to be from reliable sources; however, LPL Financial makes no representation as to its completeness or accuracy.
The Standard & Poor’s 500 Index is a capitalization-weighted index of 500 stocks designed to measure performance of the broad domestic economy through changes in the aggregate market value of 500 stocks representing all major industries.
The Dow Jones Industrial Average Index is comprised of U.S.-listed stocks of companies that produce other (non-transportation and non-utility) goods and services. The Dow Jones Industrial Averages are maintained by editors of The Wall Street Journal. While the stock selection process is somewhat subjective, a stock typically is added only if the company has an excellent reputation, demonstrates sustained growth, is of interest to a large number of investors and accurately represents the market sectors covered by the average. The Dow Jones averages are unique in that they are price weighted; therefore their component weightings are affected only by changes in the stocks’ prices.
This article was published by RSW Publishing.
LPL Tracking # 1-05155621
VIEW OUR Business Continuity Plan
CFP® Certified Financial Planner™ Certified Financial Planner Board of Standards, Inc. owns the certification marks above, which it awards to individuals who successfully complete initial and ongoing certification requirements.
Securities and advisory services offered through LPL Financial, a Registered Investment Advisor Member FINRA + SIPC.
The LPL Financial registered representative associated with this site may only discuss and/or transact securities business with residents of the Following states: NC, VA, SC, MD, DE and FL.
Financial planning services offered through LPL Financial, a registered investment advisor